
How Much Do Solar Panels Cost? 2026 Prices by System Size
How much do solar panels cost in 2026? Real installed prices per watt from Berkeley Lab, costs by system size, battery add-ons, and why no federal credit now.
Estimate how much electricity a solar system produces per day, per month, per year and over 25 years. Enter the system size and your peak sun hours; the tool applies standard system losses and yearly panel aging.
Results update as you type. Without JavaScript you see the worked example below.
A solar panel output calculator multiplies system size by peak sun hours and subtracts losses. With the defaults, a 7 kW system with 4.3 peak sun hours and 14% losses makes about 25.9 kWh a day, 787 kWh a month and 9,448 kWh a year, or 1,350 kWh per kW. Sunshine is the biggest variable.
You get yearly, monthly and daily output, output per panel, kWh per kW per year and 25-year output. A bar chart shows each year's output over 25 years, and a schedule lists every year's kWh and its percent of year-one output, with a CSV download. The scenario table reruns your system at 10% losses (clean, cool panels), your own losses, and 20% losses (shade or dust).
Daily kWh        = system kW × peak sun hours × (1 − losses)
Yearly kWh       = daily kWh × 365
Monthly average  = yearly kWh ÷ 12
Panels           = system watts ÷ panel watts (rounded)
Per panel/year   = yearly kWh ÷ panels
kWh per kW       = yearly kWh ÷ system kW
Year-n output    = yearly kWh × (1 − degradation)^(n−1)
25-year output   = sum of years 1 to 25
Assumptions that match the code:
Default inputs: 7 kW, 4.3 peak sun hours, 14% losses, 400 W panels, 0.5% degradation.
Second example, a sunny Southwest roof: 8 kW, 5.6 peak sun hours (close to the PVWatts yield for Phoenix of 1,755 kWh per kW), 430 W panels, other inputs at default.
| Scenario | Default 7 kW system, yearly | Default, 25 years | Phoenix 8 kW, yearly |
|---|---|---|---|
| 10% losses (clean, cool) | 9,888 kWh | 232,918 kWh | 14,717 kWh |
| 14% losses (PVWatts default) | 9,448 kWh | 222,566 kWh | 14,063 kWh |
| 20% losses (shade, dust) | 8,789 kWh | 207,038 kWh | 13,082 kWh |
Compare the yearly figure with the production estimate on your quote. If a proposal claims much more than this tool or PVWatts shows for the same size and location, ask what assumptions it uses. Then compare output with your use in the how many solar panels do I need tool, and turn kWh into dollars with the solar savings calculator.
Yearly output is also the denominator in cost per kWh. Our guide to how much solar panels cost explains why a cheaper system with poor output can be a worse deal.
This is an educational estimate, not a production guarantee. It uses one yearly sunshine figure and a flat loss factor, so it cannot show seasonal swings, partial shading or weather years. For a site-specific estimate, run PVWatts for your address and roof angle, and compare it with your installer's production report.
A 400 W panel getting 4.3 peak sun hours, after 14 percent losses, makes about 1.5 kWh a day, or roughly 525 kWh a year. The same panel in a sunnier place with 5.6 peak sun hours makes about 1.9 kWh a day. Output is higher in summer and lower in winter.
Peak sun hours express a day's sunlight as the number of hours of full-strength sun, 1,000 watts per square meter, that would deliver the same energy. Four peak sun hours does not mean four hours of daylight; it is a yearly average energy figure. PVWatts gives the most reliable estimate for an address.
Fourteen percent is the default total loss in PVWatts. It covers soiling (2 percent), shading (1 percent), mismatch (2 percent), wiring (2 percent), connections (0.5 percent), light-induced degradation (1.5 percent), nameplate rating (1 percent) and availability (3 percent). Inverter conversion is handled separately in PVWatts.
The default is 0.5 percent a year, the median rate found in NREL's 2012 review of about 2,000 field measurements. At that rate, year-25 output is about 88.7 percent of year one. The year-by-year schedule shows the decline and can be downloaded as CSV.
Weather varies year to year, and your roof's direction, tilt and shading matter. This tool uses a single yearly sun-hours figure and a flat loss percentage. PVWatts models your exact location, tilt and azimuth with typical-year weather data, so use it to check a quote's production promise.
With the defaults, 4.3 peak sun hours and 14 percent losses, a 7 kW system makes about 9,448 kWh a year, 787 kWh a month and 25.9 kWh a day. In a sunnier location with 5.6 peak sun hours, an 8 kW system makes about 14,063 kWh a year.
Not for a given system size. Output depends on total kW, sunshine and losses. Panel wattage only changes how many panels make up that kW, and therefore the output per panel.
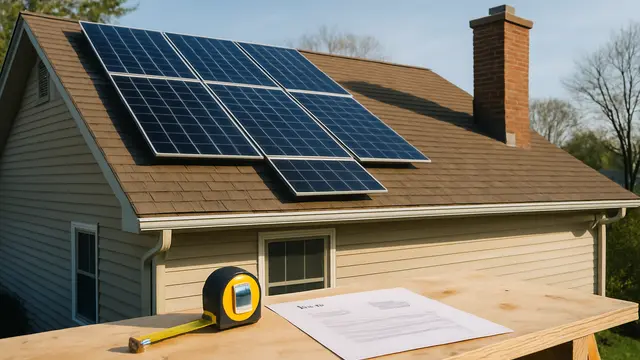
How much do solar panels cost in 2026? Real installed prices per watt from Berkeley Lab, costs by system size, battery add-ons, and why no federal credit now.

Are solar panels worth it in 2026 now the 30% tax credit is gone? See real payback math by state, the export credit effect and when solar doesn't pay.
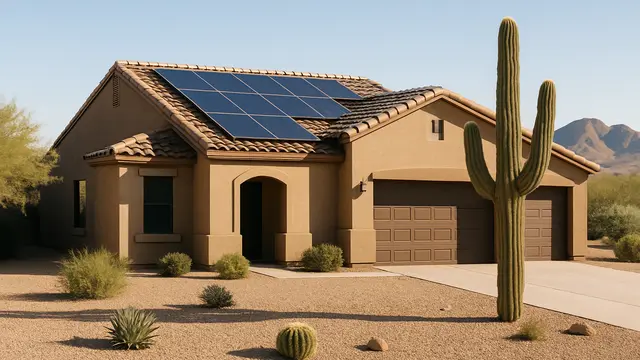
Solar panels in Arizona in 2026: APS, TEP and SRP export rates, the $1,000 state tax credit, property tax rules, HOA law and real savings math.

Solar panels in Florida in 2026: how PSC net metering works, sales and property tax exemptions, HOA rights, hurricane backup and real savings math.